Forecast the demand
A seven-day read on covers and revenue, with a confidence level for each day, so staffing and inventory have something to lean on.
RAYN RevDASH reads demand and yield across your venue — by space, by time band and by channel — connecting bookings, tables, deposits, pre-orders and guest behaviour into one operator view. Not another dashboard: a clear, honest read on where a service performed, where it left room, and what to do next.
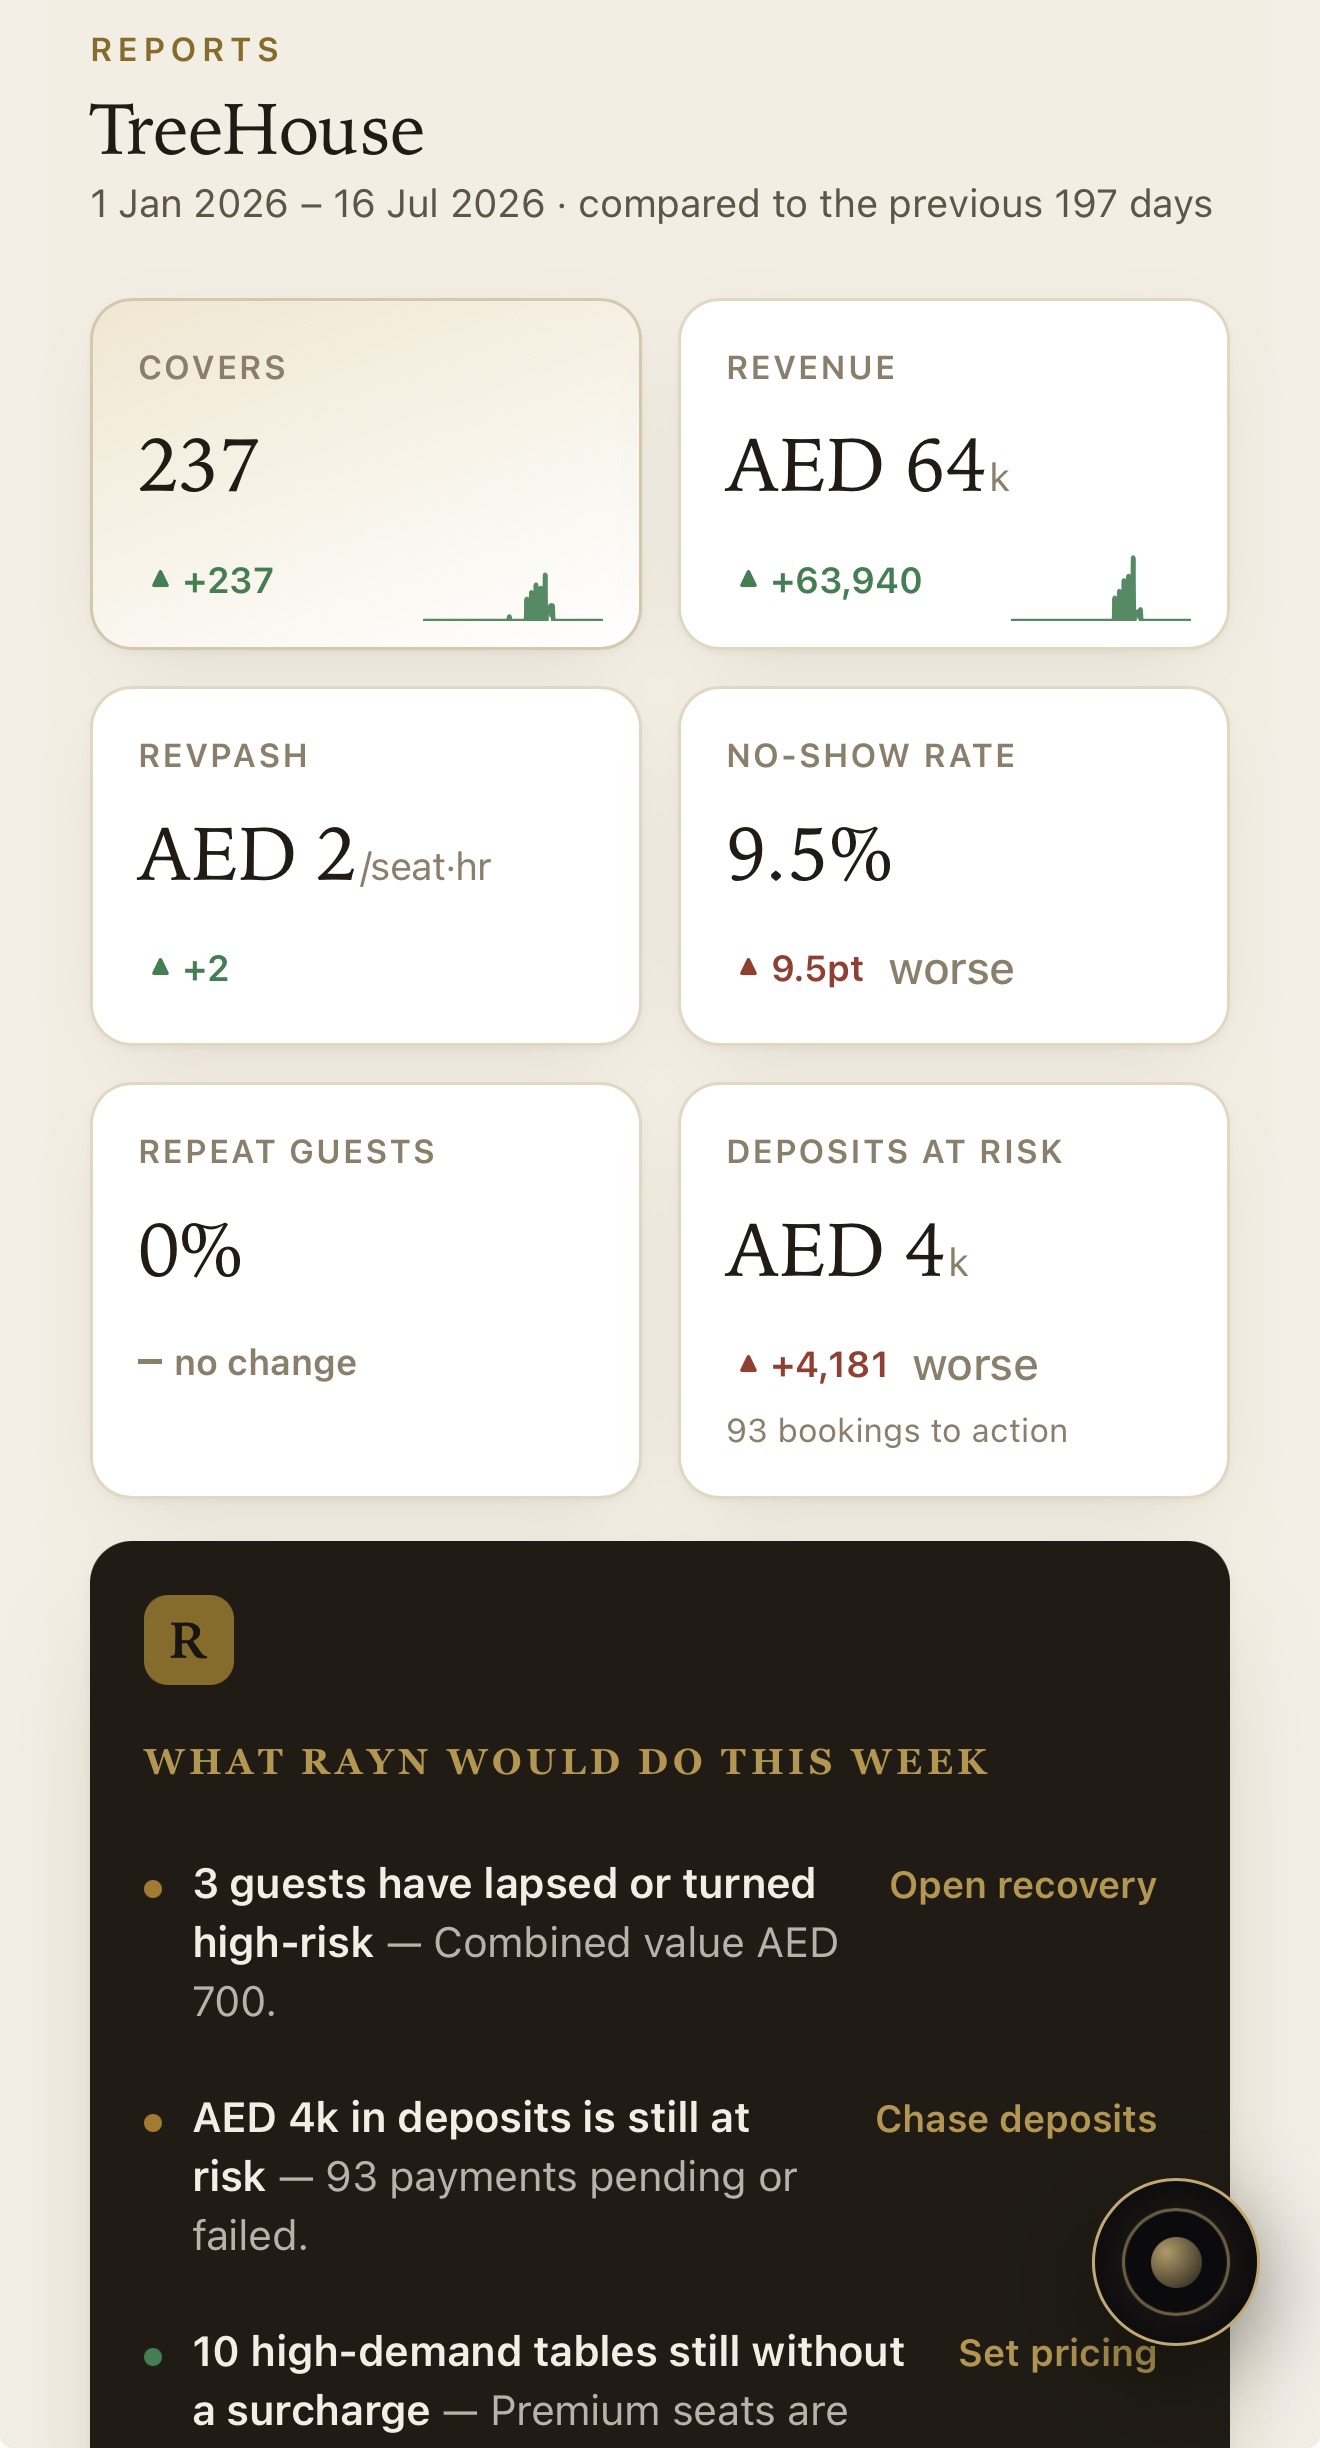
Estimates and models, made legible — not a replacement for your accounts
Revenue Intelligence brings booking state, table demand, pre-order, deposit and guest behaviour into one view — organised by space, time band and channel, connected to the signals that drive them.
A seven-day read on covers and revenue, with a confidence level for each day, so pressure is visible before it peaks or fades.
Revenue per available seat hour by zone, with utilisation and a spatial quality score, so you see how hard each seat works.
Where covers and demand were lost — the hardest number to see, the one that never happened, made visible.
Each slot marked to protect, review or yield, based on how it tends to perform — a posture, not a blunt weekly rule.
Performance read spatially, zone by zone, with an occupancy heatmap that shows which parts of the room earn their place.
Net revenue per cover by channel, so the true cost of third-party demand sits next to direct, in the same view.
Four moves that turn a read on the service into a posture for the next one.
A seven-day read on covers and revenue, with a confidence level for each day, so staffing and inventory have something to lean on.
A modelled view of actual against potential, so under-converted demand becomes visible — labelled as an estimate, not a receipt.
Each slot is marked to protect, review or yield, based on how it tends to perform, so posture is set slot by slot.
RevPASH, utilisation and a spatial quality score by zone, with an occupancy heatmap, so the room is read where covers are won.
Revenue Intelligence is built to shorten the distance between a number and a decision — with the honesty to say when a figure is an estimate.
A seven-day forecast with confidence, so staffing and inventory have something to lean on before the service, not after.
A modelled read on under-converted demand, by slot and by zone, so the covers a service could have taken stop hiding.
Protect, review or yield, slot by slot, rather than one blunt rule applied across the whole week.
RevPASH and a spatial quality score show which zones earn their place, and how that shifts by night and season.
Net per cover by channel keeps the true cost of each booking in view, so third-party demand sits honestly beside direct.
Modelled figures are labelled as models, not presented as measured truth — a tool for thinking, not a claim to it.
A seven-day forecast with confidence, so demand pressure is planned around — not discovered after the service has passed.
Yield postures, the revenue gap and spatial performance surface before the next service, not after the quarter.
Modelled figures are labelled as models, leaving the judgement where it belongs — with your team.
The learning loop that reads demand across every signal in the venue, and feeds the yield view.
Explore Product · Pick Your SpotThe spatial choices guests make feed RevPASH and the yield read, zone by zone.
Explore Product · Host StationThe read reaches service, where covers are won or lost in the moment they matter.
ExploreIt reads demand and yield across your venue by space, time band and channel, connecting bookings, tables, deposits, pre-orders and guest behaviour into one operator view. RevPASH, utilisation, the revenue gap and channel economics all sit in the same read.
No. The point is a clear, honest read on where a service performed, where it left room, and what to do about the next one — not another export that arrives after the service it describes is already over.
Revenue per available seat hour: it shows how hard each seat works across a session. RAYN reads it spatially, zone by zone, alongside utilisation and a spatial quality score, so you can see which parts of the room earn their place.
Where a figure is modelled rather than measured, it is labelled as an estimate. The gap between what a service did and what it could have done is a model, not a receipt, and it is shown that way. Where RAYN does not have a measured number, it does not invent one.
Forecasts, yield bands and spatial scores grow more useful as a venue builds history. On a new venue some views start quiet and fill in as services accumulate, so the read sharpens with your data.
See it on your venue
We'll show RevDASH reading demand, yield, spatial performance and channel economics on a live venue — a read your team can act on before the next service, not after the quarter.